Data analytics is not for the faint of heart. You need to do real work. Yet a professional who knows how to analyze and interpret data for business action will always be in demand. To be in the top 1 percent, delivering effective presentations with consumable insight, will set you apart. That’s where data visualization comes in—and exactly the inspiration behind the Wharton Data Visualization Hackathon.
Thankfully for the organizers [including the author], they had powerhouse research arms right in our backyard, such as the Wharton Consumer Analytics Initiative (WCAI). We leaned heavily on WCAI’s academic research experience and technology resources. The enthusiastic involvement from both the undergraduate and graduate students—40 students in 10 teams participated in the event on Feb. 27, 2015—was a testament to the fact that data analytics is not just a fad. It’s just getting started.
For some, in fact, it’s actually turned into quite the passion.
Monica Wojciechowski, a rising senior in the Jerome Fisher Program in Management & Technology, couldn’t resist participating in the hackathon.
“When I heard that Wharton was going to host a data visualization hackathon, I was immediately ready to take part. The opportunity to set aside some time to learn about current visualization techniques, interact with others as interested in the field as I am and have access to real data from a national car rental company genuinely interested in our insights sounded too good to be true,” she says.
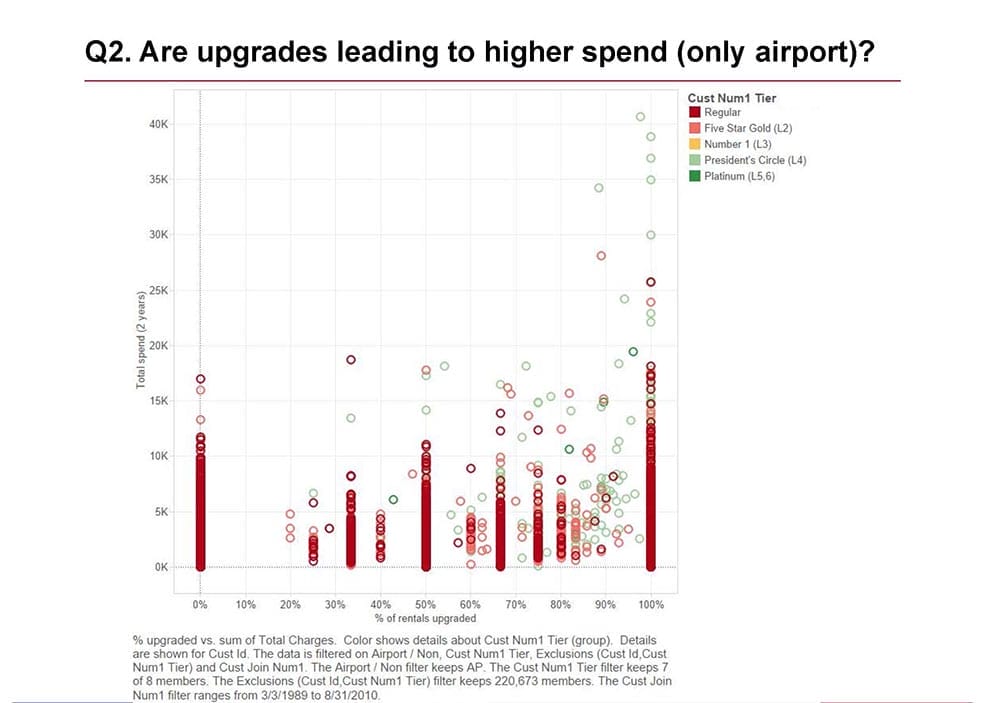
The challenge for Wojciechowski and other hackathon participants was to get access to that real-world data and then in less than five hours generate real insights, applicable business recommendations and even an interactive presentation to showcase it all.
The interaction of structured analysis and creative business communication intrigues Wojciechowski, and she sees the bigger picture of their value. As popular as the term “big data” has been in the past few years, Wojciechowski believes “data visualization” will be the next buzzword taking the stage. The world is awash in numbers, and computing and measurement abilities in a vast variety of fields having grown exponentially. The challenge is translating those numbers into something that society can truly consume.
“Creating a visually attractive and valid representation of such data can prove effective in informing the public, changing behaviors and potentially improving the world,” she says.