
I have no idea if George Soros is a hockey fan, but NHL GMs would do well to give serious thought to how his world view may already be affecting their sport.
Soros is a more interesting personality than your average hedge fund billionaire, in large part because he’s a frustrated Philosopher King for whom making tens of billions of dollars appears to have been a consolation prize. And yet his philosophical framework – known as reflexivity – has been taken seriously across multiple fields within the social sciences precisely because he has repeatedly applied it to the task of making outlandish profits.
It’s impossible to do justice to a general theory of human interactions in a few sentences, but I will try anyway.
Reflexivity boils down to three simple ideas: (i) human beings are imperfect in their understanding of the world around them; (ii) this imperfect understanding, once acted upon, causes people to make incorrect decisions; and (iii) because social systems are dynamic, incorrect decision making changes the very phenomena people were studying in the first place. In other words, it’s not just that social scientists aren’t “getting the right answer.” Rather, the imperfect ideas they share is causing the ground to shift beneath their feet, which makes the pursuit of a perfect answer quixotic to begin with. Soros has applied his thinking to financial markets, drug policy reform, and political science, to name a few fields.
As far as I’m aware, my colleagues at the Department of Hockey Analytics and I are the first to apply it to hockey.
There isn’t much for hockey writers to do in the summer, but fortunately the summer of 2014 afforded some good fodder. Over several months prior, teams finally began to take hockey analytics seriously. Front offices in Toronto, Edmonton and New Jersey all made high profile analytics hires and joined the ranks of those teams that were quietly crunching numbers already. As noted in the Toronto Star, even some of the players were buying in. There was even a fancy name: 2014 was the Summer of Analytics.
Let’s think about how Soros might view all this…
To begin with, hockey is an incredibly complex and dynamic game. As fans who remember the high scoring Edmonton Oilers of the 1980s and neutral zone trap of the New Jersey Devils in the 1990s and early 2000s, requiring players to shift between offense and defense in a matter of seconds makes it far from obvious what the optimal balance is between the two. Commentators can prattle on about “defense winning championships,” but as my colleague IJay Palansky has observed that claim is basically made up. More problematic is the fact that certain dynamics likely exist between sports teams where the “better” team (i.e. the one that would do best overall against the rest of the league) may do consistently worse against an “inferior” team.
Analytics types are reluctant to acknowledge these kinds of things because of small sample sizes, but the routine movement of players and coaches between teams means that opponents often have knowledge of each other’s tendencies, and it’s hard to imagine that doesn’t sometimes help a team pull off an upset. The “human element” is complex and unknowable, but that doesn’t mean you pretend it doesn’t exist.
Equally problematic is untangling the different relationships between teammates and opponents. Take the example of Chicago Blackhawk Patrick Kane, who is having a career season and leading the league in scoring. It’s not clear whether Kane is elevating the play of rookie sensation Artemi Panarin or whether (as Kane has claimed) Panarin is elevating Kane’s game. More likely there’s a synergy effect at work between the two linemates.
But there’s an even bigger problem in hockey analytics right now, which is its almost religious fixation on shot attempts. Because the league doesn’t (yet) employ tracking technology, analysts have no reliable measure of how long each team (or player) holds the puck. However, they do know that in order to shoot the puck you must have it in the first place, so shot attempts are used as a proxy for puck possession. Moreover, teams that have generated more shot attempts have, on average, been more successful.
A student of reflexivity theory would see at least four distinct problems here: (i) We believe puck possession wins hockey games, but because we have no measure of it, we settle for a proxy (shot attempts). That means our world view is muddled at the outset; (ii) Whatever our proxy may have told us about winning hockey games in the past, there are lots of other factors that helped win games as well. Because we haven’t settled on what those are or haven’t found ways to measure them, we’re basically pretending they don’t exist; (iii) There’s no guarantee that whatever relationship existed between shot attempts and winning in the past will apply in the future; and (iv) The fact that we now believe shot attempts are connected to winning hockey games could cause teams to overvalue shot attempts and undermine the relationship between shot attempts and winning.
This last problem is in many ways the most interesting one.
Whatever truths analysts may have uncovered about the relationship between shot attempts and winning hockey games, the world in which those events occurred was one in which that relationship was unknown. GMs didn’t select players based on their number of shot attempts for and against, coaches didn’t dole out ice time or design strategies around optimizing shot attempts, and players weren’t aware that they would be measured (and paid) by the extent to which they could game that variable. Rather, the focus was largely on goals, assists, points, penalty minutes, plus/minus and “intangibles.”
The moment analysts are taken seriously, particularly by players, the greater the possibility that whatever truth analysts have uncovered is forever altered. Take the example of Montreal Canadiens head coach Michel Therrien. Therrien is a bit of a lightning rod because he coaches a legendary team whose rabid fans demand that their coach be worthy of the club’s singular history and speak both of Canada’s official languages. He’s also an old school coach whose teams generally succeeded during the regular season despite routinely losing the battle for shot attempts – something analysts repeatedly said would spell doom for the team in the long run.
This summer the Canadiens hired a well-respected young analytics guru and it appeared Therrien’s coaching style had changed. The team got off to a torrid 9-0 start until they hit a wall. As we noted recently in Sports Illustrated, part of that wall was an injury to the league’s top goaltender, but another part of it was a team that was continuing to generate lots of shot attempts but failing to win actual hockey games.
It’s impossible to say whether Therrien or his players were losing because they were too focused on getting more shot attempts than opponents rather than scoring actual goals, but the bigger question is whether the explicit adoption of analytics orthodoxy by many teams has diminished its value.
In a word, maybe.
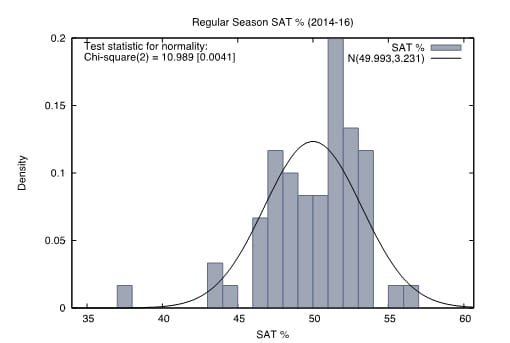
The two histograms below show the distribution of shot attempt percentage (SAT%, which measures shot attempts by each team during 5-on-5 play as a percentage of all shot attempts generated in games they played) between 2008-14 and 2014-16. The curve is there so you can compare to what a normal distribution would look like.
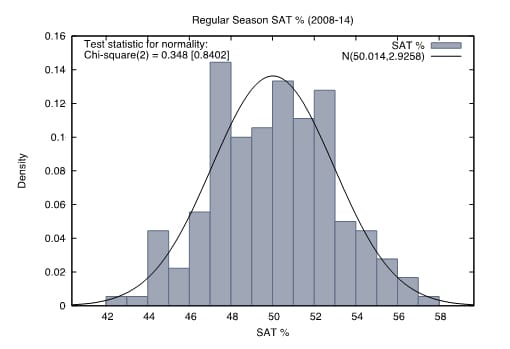


The 2008-14 data set looks like what you would expect to see in a league where teams were simply playing hockey without counting their shot attempts – some would do very well, a roughly equal number would do poorly, and most would cluster around a mean (the median of this group was in fact 50.0). In other words, you would expect something close to a normal distribution.
The 2014-16 data are far more skewed to the left, with fatter tails and a median value of 50.7. That’s more consistent with a league in which teams are all deploying tactics in order to optimize their SAT% and pummeling a small number of holdouts who either don’t accept analytics orthodoxy or simply aren’t good enough to compete. In that case, you would expect fewer teams at the high end and a bigger cluster around the middle.
To confirm (or disprove) what the eye test appears to be saying, we performed tests for normality on each sample. For the 2008-14 period we couldn’t reject the hypothesis that the data were normally distributed, but we could reject that hypothesis for the 2014-16 data set. I don’t want to overstate this phenomenon because the second sample is only one full season and about two-thirds of the current season. It also includes the 2014-15 Buffalo Sabres, who were so terrible that they may be a true outlier.
So the jury is still out as to whether this relationship will hold up over the next couple of years.
More difficult to explain away is the relationship between SAT% and winning. To get a better sense of what was going on here, we decided to perform a linear regression of each team’s SAT% against points per game played for each season.
The full results are in the chart below.
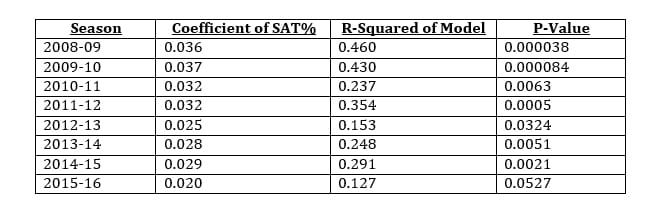

Again, sample size may be at work because this season isn’t over yet. But unless the trend changes over the next six weeks, not only has the relationship between a team’s SAT% and total points (as measured by the coefficient above) declined this season, the data have also gotten much noisier. As the p-values show, for the first time in eight seasons, SAT% isn’t even significant at the 5% level, meaning we can’t say with 95% confidence that our model is even working.
Now to be fair, the 2015-16 results (at which point all teams had played between 51 and 56 games) wasn’t much worse than the 2012-13 lockout shortened season (48 games), but the model is still faring worse in all respect with more games played.
This trend is certainly something analysts should be monitoring.
If things continue for the remaining 25-30 games of the season, this should be a warning sign. The shot attempt model had several flaws to begin with, but for all its virtues, its widespread adoption by NHL teams could very well be its undoing.
All of this isn’t to say that shot attempts, let alone the broader field of hockey analytics, should be tossed out the window. But it is yet another reminder that analysis of any dynamic social system – and a game as complex as hockey is surely that – requires respect for one’s own limitations as well as the complicated feedback loops between new knowledge and the dissemination of that knowledge among the game’s participants.
In other words, NHL GMs would do well to acquaint themselves with the teachings of Soros the Philosopher.