
Bill Gates once said, “Success is a lousy teacher. It seduces smart people into thinking they can’t lose.” The Montreal Canadiens are the NHL’s most successful franchise of all time with 24 Stanley Cup wins, and the league’s poster boys for Gates’ cautionary adage.
Montreal earned its last eight Stanley Cups between 1971 and 1993 on the backs of two of the greatest goaltenders to ever play the game: Ken Dryden and Patrick Roy. Dryden’s story was particularly compelling, as it involved a late season call up of a rookie who turned down Harvard Law School to pursue an NHL career and ended up winning the Conn Smythe Trophy as playoff MVP and his first of six Stanley Cups with the team.
Canadiens fans could be forgiven for believing that goaltending wins championships. The team’s management, intoxicated with their own history, seemed to agree when they signed Carey Price, one of the greatest goalies in the game today, to an eight-year, $84 million contract extension that will consume approximately 14 percent of the team’s salary cap space.
Unfortunately, having the best goalie in the game matters a lot less in today’s NHL than it once did.
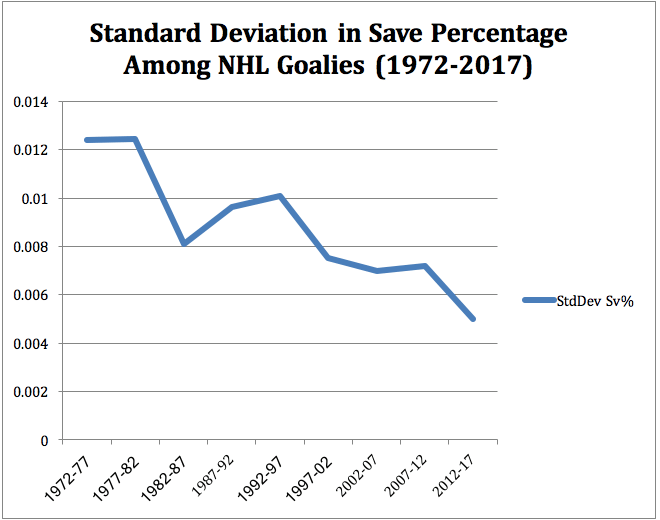
The chart below takes every five-season period from 1972-73 until 2016-17 and shows the standard deviation in the percentage of shots on net that were stopped (save percentage, or Sv%) among goalies who played at least 100 games in each five-year period. (Dryden retired after playing 99 games between 1977-79, but was by far the best in the 1977-82 period, so I included him nevertheless.)
 *Goalies who played at least 100 games during each five-year period
**1977-82 period includes Ken Dryden, who played only 99 games
***All statistics are from nhl.com and hockey-reference.com
As the chart shows, the variance in save percentage among goaltenders has declined over the past 45 years, with a major drop over the past five. Put simply, the gap between better goalies and worse ones has narrowed over time.
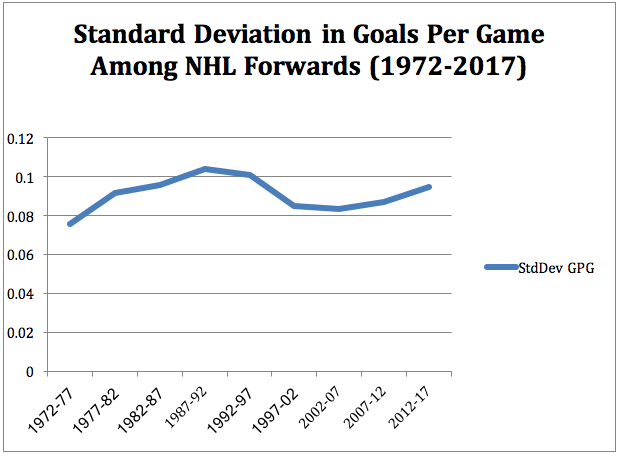
Meanwhile, the value of better goal-scoring forwards has remained roughly equal.
The chart below shows the standard deviation in goals scored per game (GPG) by NHL forwards who played at least 200 games in each five-season period.

*Forwards who played at least 200 games during each five-year period.
The variance in goal scoring among forwards has declined somewhat since a peak in the 1987-1997 period—when Wayne Gretzky and Mario Lemieux dominated—but otherwise it has remained within a relatively narrow band and has increased modestly in recent years.
Of course, standard deviations do not always tell the full story. If a single player is heads and shoulders above a pack that is roughly equal, that fact might be obscured by a low standard deviation.
The chart below shows what would happen if the top goalie in each five-year period had instead saved the same percentage of shots as: a goalie in the top 25 percent during that period; one in the top 50 percent; or one in the top 75 percent.
So, for example, if Ken Dryden, who had a .920 Sv% in the 1972-77 period had instead posted a .902 Sv% (top 25 percent), then based on the 6,314 shots Dryden faced in 228 games, Dryden would have given up an additional 0.5 goals per game.
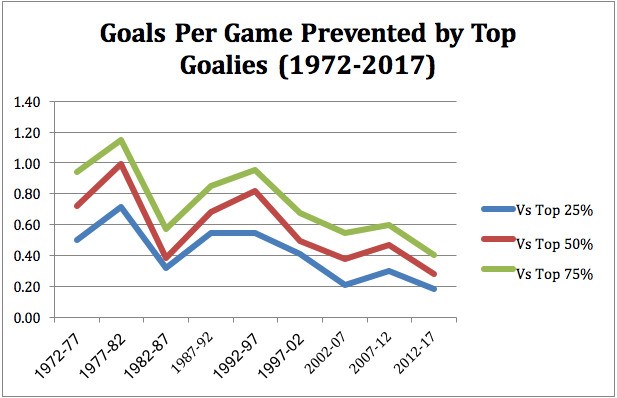

During the 2012-17 period, Price’s league-leading .925 Sv% was certainly impressive, but it was not that much better than the top 25 percent level (.919) or even the 50 percent level (.916). As a result, based on his 6,958 shots against and 238 games played, Price would have given up only an additional 0.18 goals per game if he was a top 25 percent goalie, and only 0.28 more goals per game if he was merely average. Even being well below average (top 75 percent Sv% of .911) still would have caused Price to give up only an additional 0.40 goals per game against.
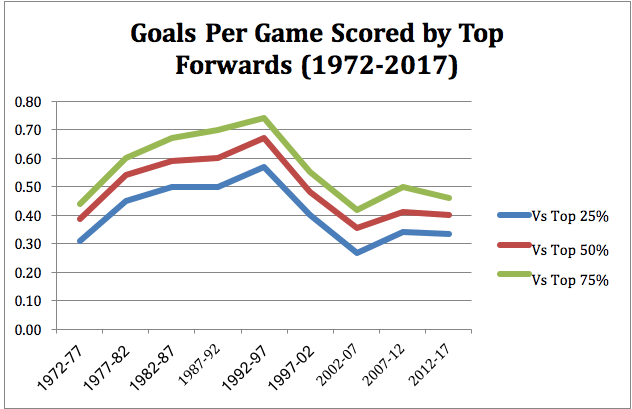
Meanwhile, while the difference between the top goal scorer in the league and everyone else has declined since the 1982-1997 period, for the past decade it has remained slightly above mid 1970s levels.

The final chart quantifies a conundrum faced by a team operating in a league with a salary cap, namely how to determine the relative value of a top goaltender compared to a top scoring forward.
So, for example, if having Ken Dryden as opposed to a top 25 percent goaltender would have saved 0.5 additional goals in the 1972-77 period, and having Phil Esposito, whose 0.65 goals per game was 0.31 goals per game better than a top 25 percent forward, Dryden’s value relative to Esposito’s would have been 0.19 goals per game.
It is important to note that because goalies do not play every game, this analysis favors goalies (Esposito played 389 games during that period and Dryden played only 228).
As the data make clear, during the 1972-82 period, top goaltending mattered a great deal relative to scoring.
During the 1982-87 period, the value of having Gretzky’s 0.88 goals per game far outweighed what was a relative dark age for goaltending (where Bob Froese was the best in the league with a .897 Sv%). In the 1987-97 period—in which Patrick Roy dominated at first, followed by Dominik Hasek—goaltending continued to rule the roost before beginning a 20-year decline. Again, the past five years have been noteworthy in that for the first time since 1982-87 (when Gretzky was in his prime), the difference between top goaltending and forwards has been negative at each of the 25 percent, 50 percent and 75 percent levels.
If one is looking for a longer-term trend, it seems that the dominant strategy for the past 25 years has been to try to find a goalie who is good enough to be in the top 25 percent among regular starters but not to worry too much about finding the best.
By signing the world’s best goalie to the league’s most expensive contract, the Canadiens have made an enormous bet that a decades-long trend will reverse.
Like every business that has seen its day, they would have been far wiser to heed Gates advice and stop living in their storied past.