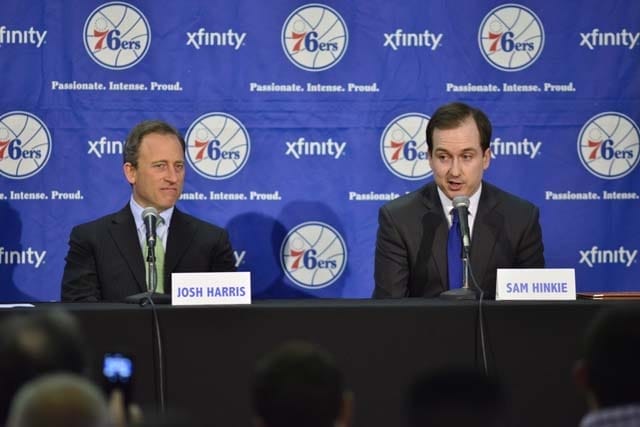
Former 76ers head coach Doug Collins declared famously that he would “blow my brains out” if he had to read statistical analyses of basketball games. His successor, no doubt, will be reading at least some of those summaries. The team’s new president and general manager, Sam Hinkie, is an analytics guy. That’s a good thing.
The first player taken in the 1973 NBA draft, Doug Collins is one of my all-time favorite 76er. He was the Philly player who most frustrated the then-dominant Boston Celtics because he was continuously in motion. Collins was all over the court all the time, with or without the ball.
He has a legitimate point about the limits to reading players and play quantitatively.
Analytics work better in American football and, especially, baseball because these are discontinuous games. Quantitative analysis started in baseball, largely through the pioneering efforts of Bill James and SABR, the Society for American Baseball Research. James defined “sabermetrics” as “the search for objective knowledge about baseball.” This concept gained popularity through Billy Beane and the overachieving Oakland Athletics, as profiled in Michael Lewis’ bestseller, Moneyball.
Sabermetrics fits baseball because the game is so modular; even there, however, scouting is not irrelevant. Indeed, Beane told Nate Silver, the author of The Signal and the Noise, that “the A’s scouting budget is now much higher than it has ever been … it was the As’ fascination with statistical analysis that led them to increase it.”
I have always been skeptical about the value of statistical detail in basketball because of the dynamic, collaborative nature of the sport. The Celtics have won a record 17 NBA titles, yet they never have they had the league’s leading scorer. As their legendary coach, the late Red Auerbach, observed, the only thing modular in basketball is the shooting of free throws. Everything else turns on the interaction of 10 players.
I’m sure that Hinkie is smart enough to grasp the limits of “money basketball.” But he also knows that statistics about player contributions, tendencies and combinations can tip the balance, just as player and play adjustments can in American football.
When I was writing my first book, Game Plans: Sports Strategies for Business, I interviewed Carl Peterson, then-president of the USFL Philadelphia Stars and former Eagles general manager and future Kansas City Chiefs president. I asked him to what extent an NFL game reduced to preparation versus adjustment. Carl opined 75 percent/25 percent—with most of the significant changes occurring during halftime. For a long while thereafter, in talks and consulting gigs, I quoted the three-to-one ratio to underscore the importance of top-down planning in football. That game is by any measure hierarchical.
Then I became aware of some statistics that gave me pause. Roughly half of all NFL games are decided by six to seven points, and about one-quarter by only three; hence, even though football is preparation intensive, adjustment can be pivotal.
So the answer to the question that I began with—scouts or stats?—is: both of the above. In other words, it is that MBA, not NBA, staple: a two-by-two matrix, with the northeastern quadrant the winner.


