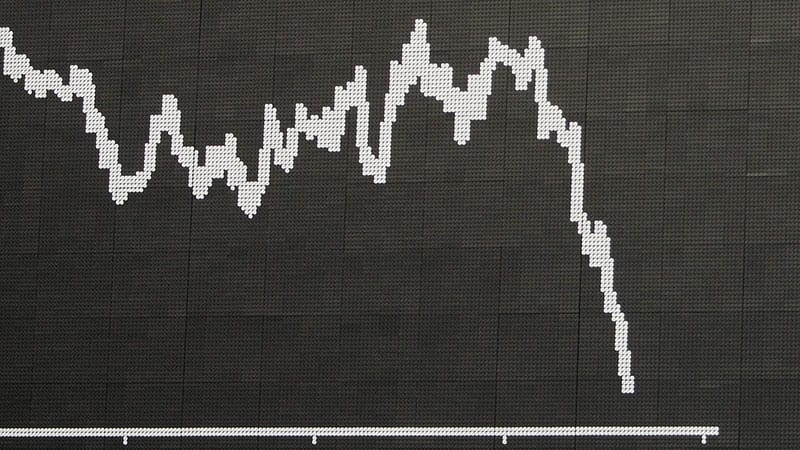
The New Year started off with a big bang. In the first three weeks of 2016, $7.8 trillion in stock market value evaporated. I am frustrated by an utter lack of insight into why.
To be sure, media outlets offer commentary, but their explanatory power is, sadly, too easy to dismiss.
Meanwhile, there are hints of what could be behind the plunge but a lack of data to substantiate them.
Government should provide investors with much more transparency. Otherwise, the loss of confidence could endanger the vitality of our capital markets.
Before getting into that, let’s review the damage. As Bloomberg wrote in January, “$7.8 trillion was erased from the value of global equities this year on China’s slowdown and oil’s crash.” The use of the word “on” in this sentence raises lots of questions:
- What is the extent of the China slowdown and the oil crash since the start of 2016?
- How much of that is a surprise, and how much was known at the beginning of 2016?
- Are we to conclude that China’s slowdown and oil’s crash caused the plunge in global equity values?
- If so, what is the precise mechanism wherein China’s slowdown and oil’s crash led to a $7.8 trillion loss in stock market values?
I believe the answers are: not much, very little, I don’t think so and no discernible mechanism.
Oil Price Plunge?
The oil price “plunge” had mostly already happened as 2016 dawned. Moreover, the economic benefits in the form of much lower gasoline prices roughly offset the economic costs to energy producers and their suppliers. About 19 months ago, oil traded at $100 a barrel—plunging 70 percent since. This does not explain why stocks plunged in the first three weeks of January. After all, oil was at $35 a barrel at the end of 2015. Could the loss of $5 more per barrel explain the Standard & Poor’s 10 percent loss since then?
To be sure, the part of the economy dependent on oil is hurting, but that represents a mere 2.5 percent of U.S. gross domestic product, according to Capital Economics. And for every penny drop in the price of gasoline, $1 billion is supposed to be added to GDP, according to Amherst Pierpont.
If that’s right, the 40-cents-a-gallon drop in gas prices in the last year, according to the Energy Information Administration, should add $40 billion to GDP—mostly offsetting the economic damage of lower prices to oil and gas suppliers.
China Implosion?
China’s economy, while the world’s second largest, is not a big factor for the U.S. economy. Moreover, even the most pessimistic forecast I saw—George Soros’ 3.5 percent GDP growth forecast—still shows China growing faster than the U.S. economy.
It’s true that the Shanghai index has fallen more than 20 percent from its December high. U.S. stocks have behaved as if the U.S. and China markets were interchangeable. But this stock market behavior suggests that investors believe that the two economies—whose prospects those markets are supposed to predict—are in exactly the same condition.
About 7 percent of U.S. exports go to China, according to Wells Fargo Securities, and China is officially forecast to grow at 6.5 percent. To be sure, that official statistic is too high. But is China really imploding? And if it does, that 7 percent represents a mere 0.9 percent—I estimate 2015 U.S. exports to China totaled $164 billion—of the United States’ 2015 GDP of about $18 trillion, according to the International Monetary Fund.
In short, the two economies are very different and the U.S economy is not as tightly linked to China’s as the hype would suggest.

Photo credit: Ralph Orlowski/Thinkstock
With China and oil prices failing to explain the loss of global stock market value, I am left with an educated guess. The pressure to get capital out of global equities, particularly U.S. stocks, exceeds the pressure to buy them.
Why might that be happening? I am guessing that countries that are suffering from the 70 percent drop in the price of oil over the last 19 months are trying to make up the difference by dumping U.S. stocks.
Indeed, Bloomberg has tracked $100 billion of Saudi Arabian foreign-exchange reserves being spent in the last year “to plug its biggest budget shortfall in a quarter-century.”
Could Saudi Arabia be selling its U.S. stock holdings to help close that budget gap? Could China, with 13 million vacant homes and an increasingly aggressive attitude toward writing off bad loans, be selling its U.S. stock holdings to offset the losses it is taking from loans that will never be repaid?
The absence of insight into how capital is flowing in and out of U.S. stocks is further eroding confidence in our markets.
A Modest Proposal for Market Transparency
Now, back to my modest proposal for transparency.
I propose a leap in market transparency. U.S. market regulators should publish real-time data on capital flows.
This data would answer the two simple questions:
- Which institutions are buying the most stock and why are they buying?
- Which institutions are selling the most stock and why are they selling?
Sure, such reporting could only be put in place after overcoming enormous political and technical obstacles, but I am quite confident that it would shed far more light into why global markets plunged than the ”explanation” that it’s all due to China and oil prices.


